
Over 2 million websites now use Microsoft Clarity — a heatmap tool that costs nothing, imposes no session limits, and includes AI-generated summaries. Meanwhile, Crazy Egg charges $29 per month for 5,000 tracked pageviews. That gap in pricing tells you almost everything about how fragmented the heatmap tracking market has become. Some tools are genuinely free with broad feature sets; others charge enterprise rates for capabilities most small site owners will never need. This guide compares the leading heatmap tracking tools for websites, covers what each type of heatmap actually shows you, explains how the technology works, and walks through setup on WordPress — with no affiliate links and no promotional fluff.
Google Analytics for beginners
What Heatmap Tracking Actually Shows You
Traditional analytics tools answer the question “how many.” Google Analytics tells you how many people visited a page, how long they stayed, and what percentage bounced. A heatmap answers a different question entirely: where did those visitors focus, click, and stop reading?
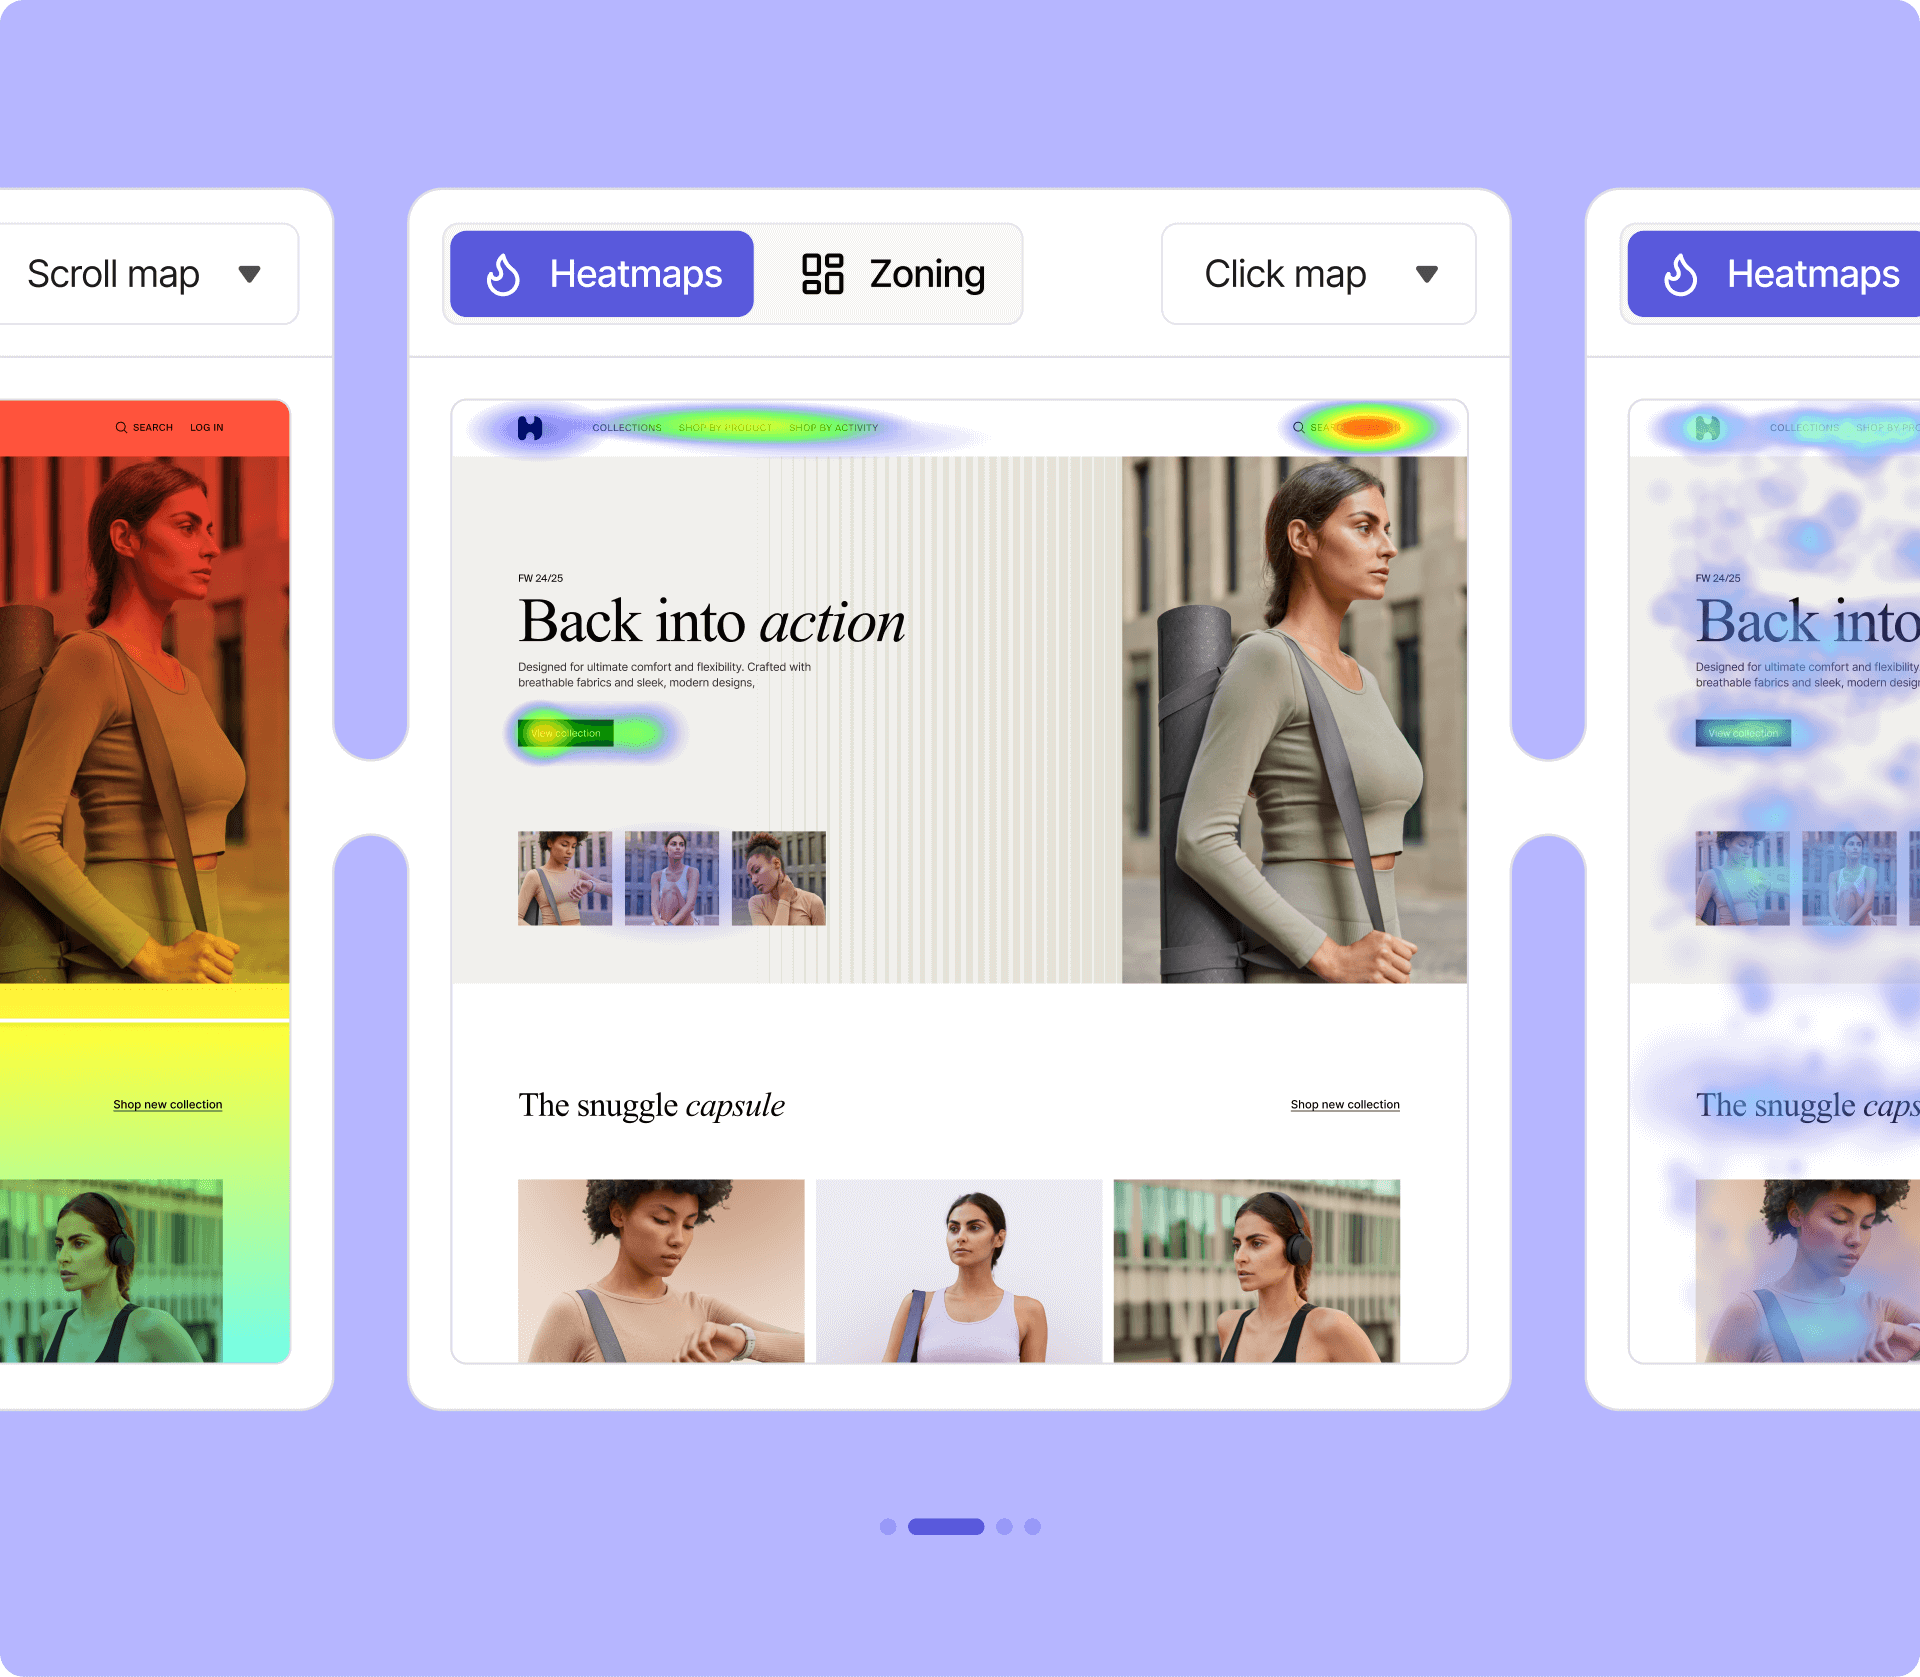
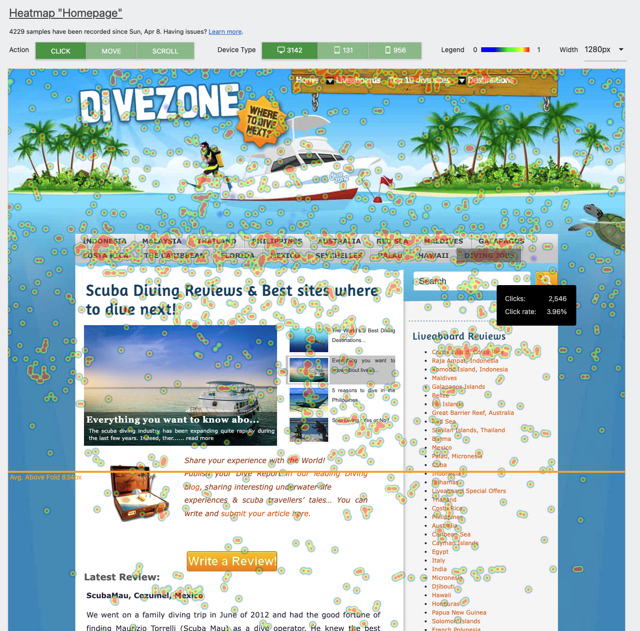
A heatmap overlays a color-coded gradient on top of a web page screenshot. Areas with heavy interaction appear in warm tones — orange and red. Areas that receive little or no attention appear in cooler blues and greens. The deeper the red, the more concentrated the activity. Run this on your homepage and you immediately see whether visitors are clicking the navigation item you want them to, or whether they’re hammering a non-clickable image thinking it should do something.
The term “heatmap” was trademarked in the early 1990s by Cormac Kinney, originally for a color-coded financial data display (Contentsquare Heatmap Guide). Web analytics platforms adopted the concept in the mid-2000s, and the category has expanded steadily since. Today the tools go well beyond static color overlays — capturing mouse movement paths, scroll depth percentages, session recordings, and even AI-generated predictions of where visitors will look before any real user data exists.
The core value is behavioral context. Numbers alone rarely explain why a page underperforms. Heatmap data surfaces patterns that make the answer visible.
Website analytics tools overview
The 6 Types of Website Heatmaps (And When Each One Matters)
Not every heatmap shows the same thing. Confusing a scroll map with a click map leads to wrong conclusions. Here are the six main types and what each one is actually good for.
1. Click Maps
Click maps record every click or tap on a page and aggregate them into a visual overlay. They answer: what are visitors actually clicking on? Common findings include users clicking on non-linked images they expect to be buttons, ignoring primary CTAs in favor of secondary navigation, or tapping on elements that have no function. On mobile, click maps record tap interactions and can reveal touch-target sizing issues. Most heatmap tools — including Microsoft Clarity, Hotjar, Crazy Egg, and Matomo — offer click maps as a standard feature.
2. Scroll Maps
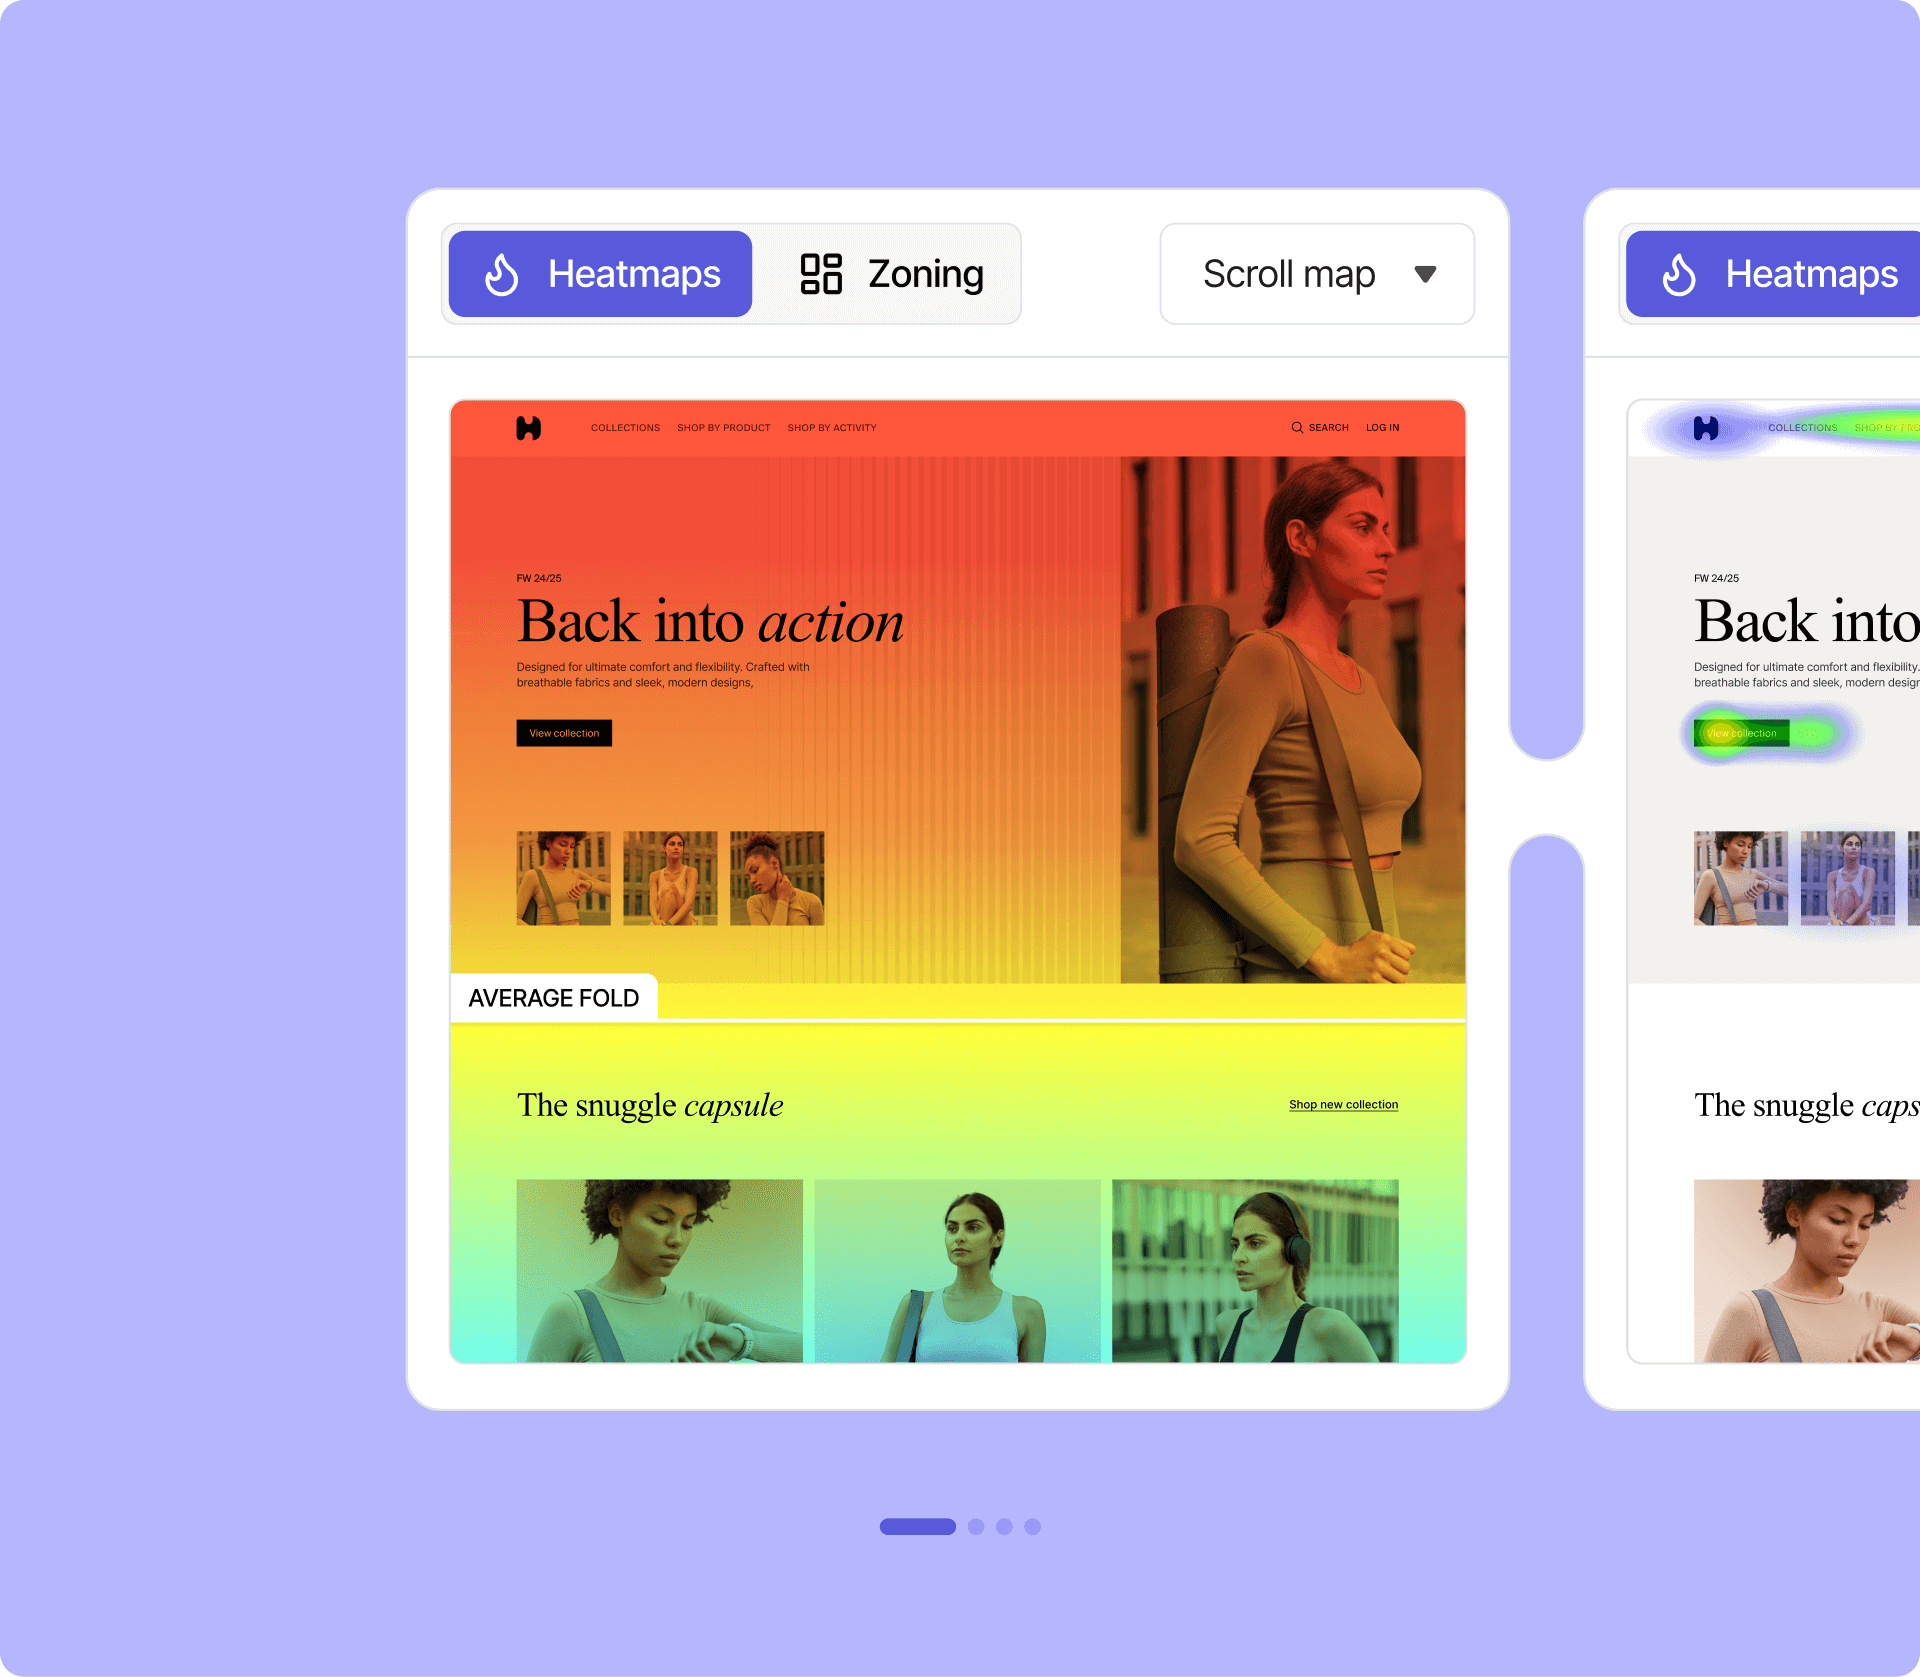
Scroll maps show the percentage of visitors who reached each point on the page. A scroll map might reveal that 85% of visitors see the top of the page but only 22% reach the section where your most important content lives. That single insight frequently drives page restructuring decisions more than months of A/B testing hypotheses. Scroll depth data is available in most tools, including the fully free Microsoft Clarity.
3. Mouse-Move / Cursor Tracking Maps
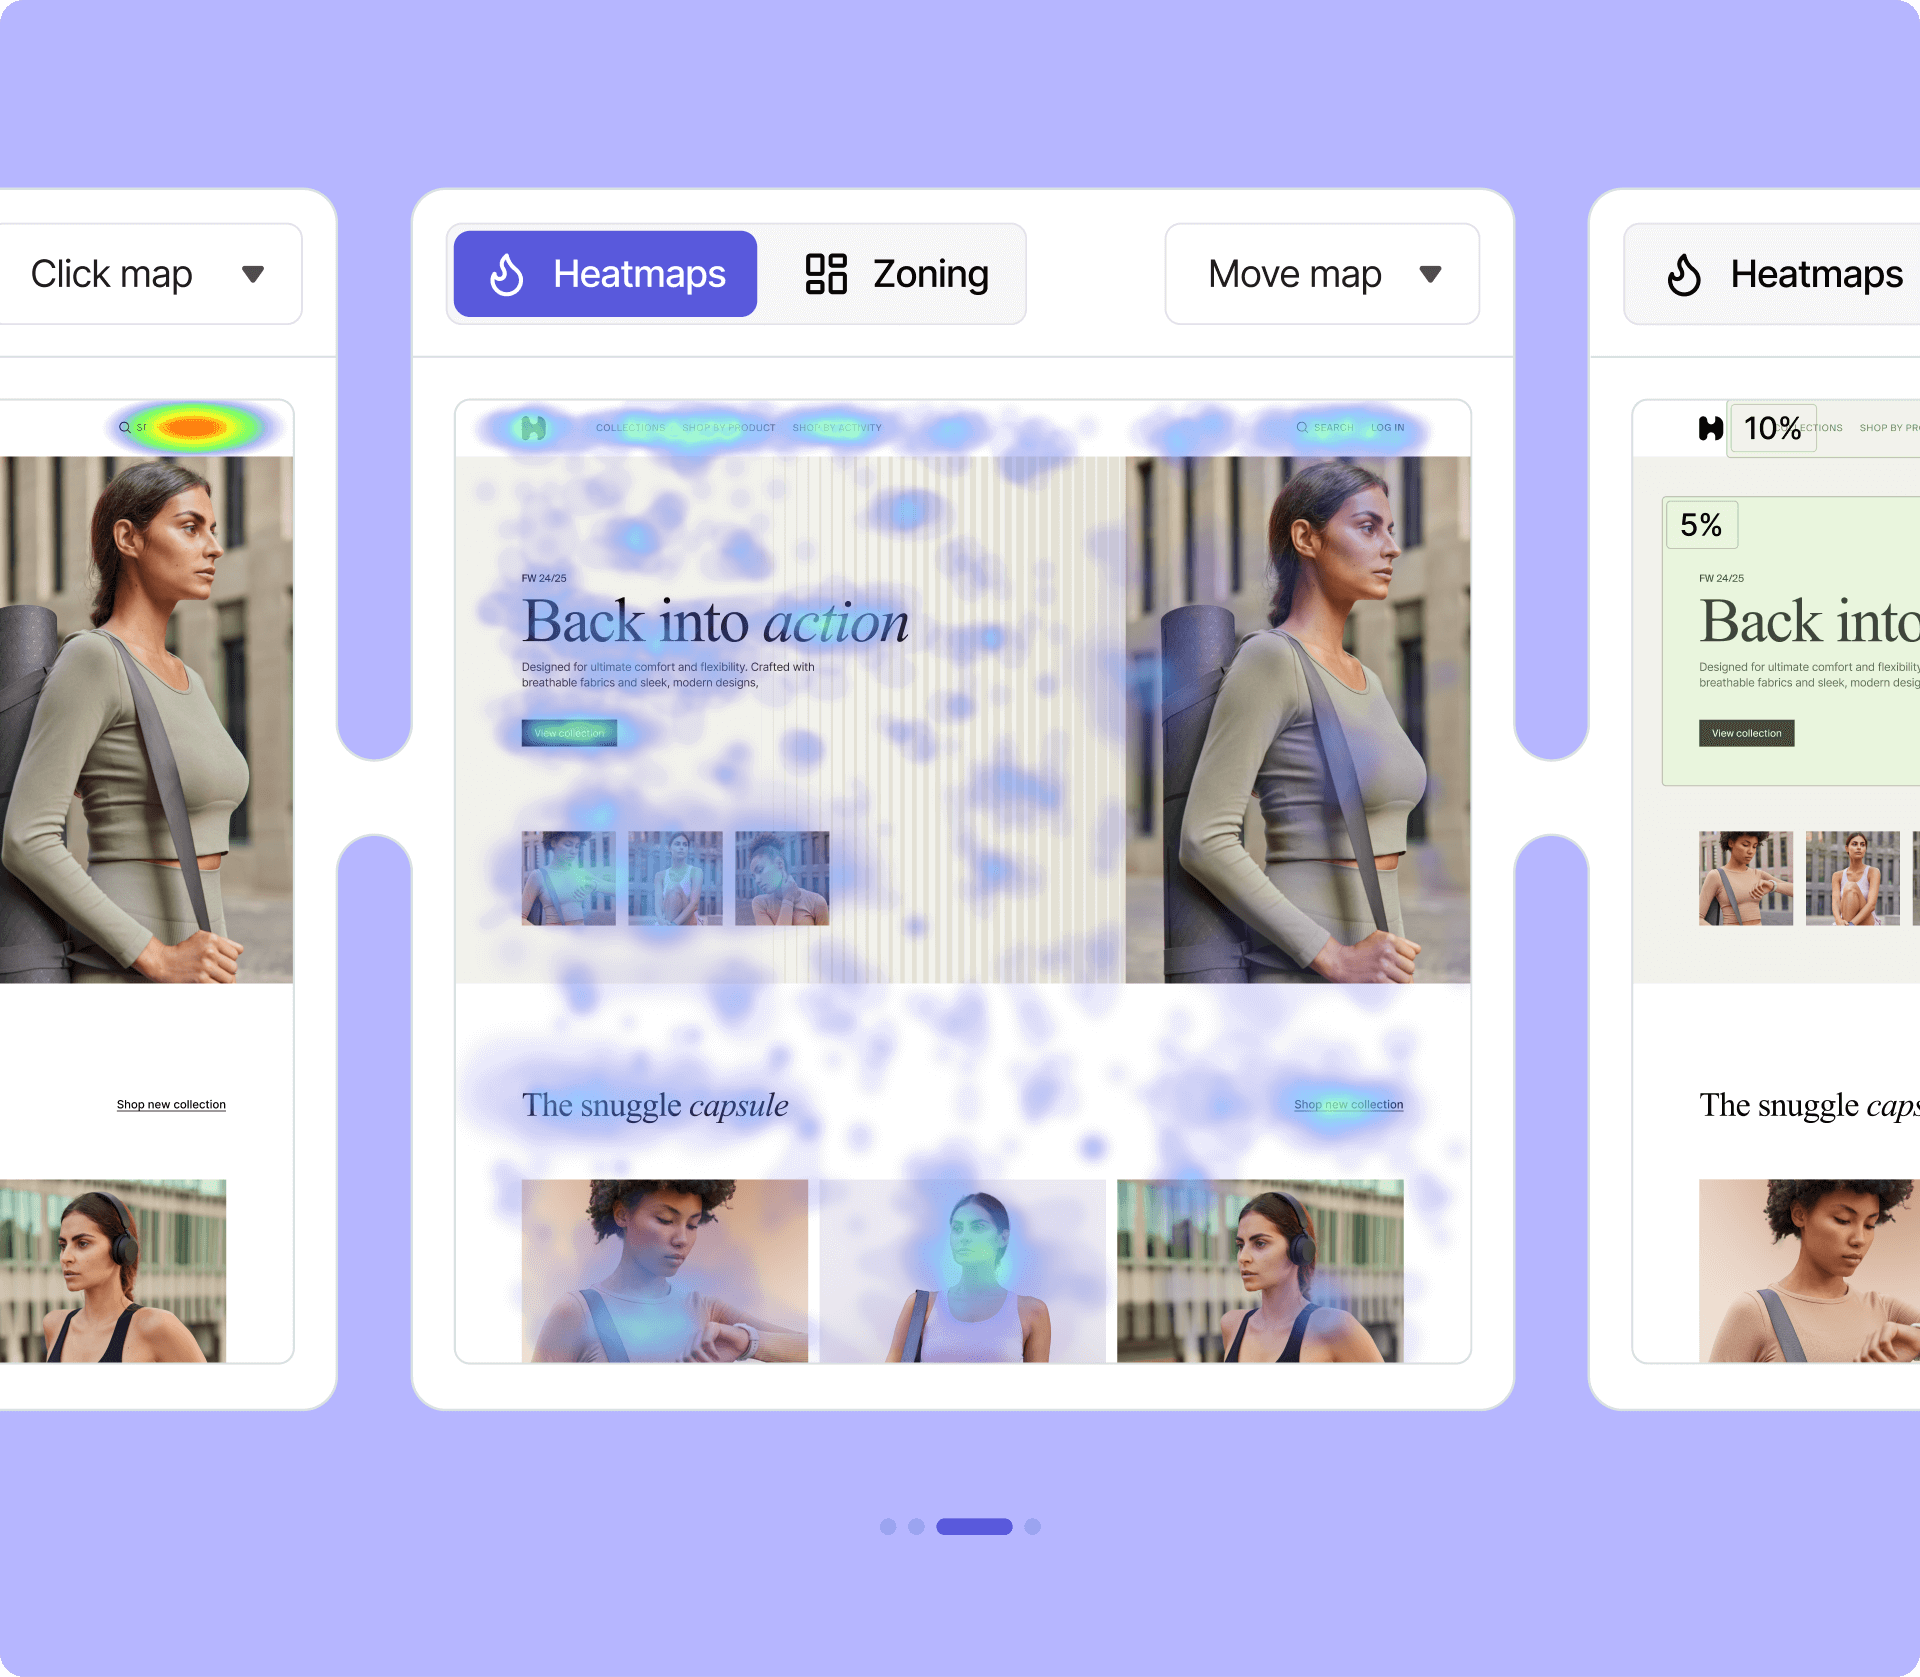
Move maps record mouse cursor paths rather than clicks. On desktop browsers, cursor movement correlates loosely with where a user’s eye is tracking — people tend to move their cursor toward text they’re reading. The correlation is imperfect, and move maps should supplement rather than replace click and scroll data. Microsoft Clarity, Hotjar, and Matomo all include move-map tracking. On mobile devices, cursor tracking is replaced by touch gesture patterns.
4. Rage Click Maps
A rage click occurs when a visitor rapidly clicks or taps the same element multiple times — a clear signal of frustration. The element may appear to be a button but doesn’t respond, a link may be broken, or a form field may not be accepting input. FullStory pioneered the rage click metric as a distinct data type. Microsoft Clarity also flags rage clicks automatically. Identifying pages with high rage click rates often reveals bugs or UX problems that standard analytics completely miss.
5. Dead Click Maps
Dead clicks are clicks on elements that have no interactive function — plain text, decorative images, or static elements that visitors mistake for links. A high dead-click rate on a particular area usually means visitors expect that element to do something. This is valuable for redesign decisions: if visitors persistently click an unlinked product image, adding a link there is an obvious improvement.
6. Eye-Tracking and AI-Generated Heatmaps
Traditional eye-tracking requires hardware lab setups and willing participants. Several heatmap platforms now offer AI-generated attention predictions — algorithmic estimates of where visitors will look based on design patterns, contrast, and known gaze behavior models. FullStory and some enterprise tools offer AI-generated heatmaps. These are most useful during design review before a page goes live, when no real session data yet exists. Treat them as directional rather than definitive.
How Heatmap Tracking Works Under the Hood
Suppose a visitor lands on your homepage. Before they do anything, a small JavaScript snippet — placed in the page’s <head> or loaded via tag manager — starts listening to their interactions. Every click, scroll position, and cursor movement generates an event that the heatmap tool records. When enough sessions accumulate, the tool overlays the aggregated data on a screenshot of your page.
Most tools capture data in one of two ways:
- Sampling: Only a percentage of sessions are recorded (common in enterprise tools to manage data volume and cost).
- Full capture: Every qualifying session is recorded (Microsoft Clarity operates this way for free).
Session limits are a critical billing factor. A “session” typically means a single continuous visit by one user. If a tool charges per session or caps sessions at a monthly limit, high-traffic sites hit ceilings quickly. Crazy Egg, for instance, bills by tracked pageviews — its $29/month Starter plan covers 5,000 pageviews. For a site with 50,000 monthly pageviews, that means either upgrading or capturing only a fraction of traffic.
Dynamic pages — those built with React, Vue, or other JavaScript frameworks, as well as sites using AJAX-loaded content — pose a specific technical challenge. Static heatmap tools built for traditional page loads may miss interactions on dynamically rendered elements like modal pop-ups, dropdown menus, and infinite-scroll feeds. Lucky Orange explicitly markets its dynamic heatmap capability as a solution to this, tracking interactions on SPAs (single-page applications) and AJAX-loaded content.
On the privacy side, heatmap tools do not record typed text in password fields. Most compliant tools also mask text in form inputs, credit card fields, and other sensitive areas by default. IP addresses are typically anonymized before storage.
Top Heatmap Tracking Tools for Websites: Side-by-Side Comparison
Microsoft Clarity’s adoption across 2 million websites has established free, full-featured heatmap tracking as a realistic baseline — not an exception. The tools below represent the most widely adopted options across different budget and feature categories as of early 2026.

Microsoft Clarity
Clarity is the most significant free tool in this category. It provides click, scroll, move, and drop-off heatmaps at no cost, with no stated traffic or session limits. AI summaries generate written takeaways from session data without requiring manual review. The AI chat feature allows conversational queries against your data. For personal sites and small businesses operating on tight budgets, Clarity is the default starting point. The main trade-off is that Microsoft receives your behavioral data, which some privacy-conscious operators prefer to avoid.
Hotjar (now Contentsquare)
Hotjar was acquired by Contentsquare and its pricing now routes through Contentsquare’s platform. The free tier provides 200,000 sessions per month with basic heatmaps and session replays. The Growth plan starts at $49/month and adds zone-based heatmaps, journey analysis, and Sense AI. For teams that need more than Clarity’s free offering but aren’t ready for enterprise contracts, this tier is a reasonable step up. The product retains Hotjar’s reputation for approachability while gaining Contentsquare’s deeper analytics capabilities.
Crazy Egg
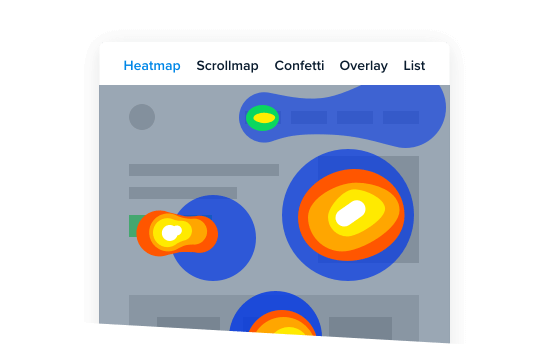
Crazy Egg differentiates with its Confetti Map — a variation on click maps that shows individual click dots color-coded by segment (traffic source, device type, etc.). It also bundles A/B testing into its paid plans, making it a two-in-one tool for sites actively running conversion experiments. The Starter plan at $29/month covers only 5,000 tracked pageviews, which is insufficient for any site with meaningful traffic. The Plus plan at $99/month and 150,000 pageviews is more practical for an active small business site. All plans include unlimited domains and team members, which is genuinely useful for agencies managing multiple client sites.
Lucky Orange

Lucky Orange’s primary differentiator is dynamic heatmap tracking — full support for SPAs, React, AJAX, and other JavaScript-heavy sites that trip up static heatmap tools. It also includes form analytics, showing exactly where users abandon forms, and live real-time heatmaps. For e-commerce sites built on modern frameworks, this matters considerably. Pricing was not available via direct fetch at time of writing — verify current plans at luckyorange.com/pricing.
Matomo
Matomo is the only tool in this list that can be self-hosted for free with full data ownership. The open-source core is free; the heatmap and session recording functionality is a paid plugin on the on-premise version, starting at roughly $22/year on the lower end. The cloud-hosted version starts at approximately $26/month for 50,000 hits. For organizations where GDPR compliance and data sovereignty are non-negotiable — healthcare, legal, finance, European businesses — Matomo’s self-hosted option removes the question of third-party data processing entirely. The trade-off is a more involved technical setup compared to a JavaScript snippet installation.
FullStory

FullStory positions itself as a Digital Experience (DX) Data platform rather than a simple heatmap tool. Its heatmap coverage is the most comprehensive available — click, scroll, mouse-tracking, eye-tracking prediction, error click, rage click, dead click, and AI-generated heatmaps. A free plan exists with approximately 1,000 monthly sessions (the site references 30,000 free monthly sessions in some contexts — verify current limits at fullstory.com/pricing). Paid pricing is not publicly listed and requires a sales conversation, placing it firmly in the mid-market to enterprise category.
Heatmap.com
Heatmap.com emphasizes revenue optimization rather than pure behavior analytics, claiming that a customer achieved 23% year-on-year revenue growth. The tool tracks revenue impact alongside behavioral data, positioning itself for e-commerce teams. Pricing is not publicly listed at time of writing — check heatmap.com directly.
Comparison Table
| Tool | Free Tier | Starting Price | Click Map | Scroll Map | Move Map | Session Recording | A/B Testing | GDPR | Best For |
|---|---|---|---|---|---|---|---|---|---|
| Microsoft Clarity | Yes — no limits | Free | Yes | Yes | Yes | Yes | No | Yes | Budget-conscious sites, beginners |
| Contentsquare (Hotjar) | Yes — 200k sessions | $49/month | Yes | Yes | Yes | Yes | No | Yes | Growing SMBs, teams |
| Crazy Egg | 30-day trial only | $29/month* | Yes | Yes | No | Yes | Yes | Yes | CRO-focused marketers |
| Lucky Orange | Verify at site | Verify at site | Yes | Yes | No | Yes | No | Yes | SPA / modern JS sites |
| Matomo Cloud | No | ~$26/month* | Yes | Yes | Yes | Yes | No | Yes | Privacy-first cloud users |
| Matomo On-Premise | Yes — core free | Plugin ~$22/year* | Yes | Yes | Yes | Yes | No | Yes | Full data ownership, self-hosted |
| FullStory | Yes — limited sessions | Contact sales | Yes | Yes | Yes | Yes | No | Yes | Mid-market / enterprise |
| Heatmap.com | Verify at site | Verify at site | Yes | Yes | No | No | No | Yes | E-commerce revenue focus |
* Prices verified March 2026. All pricing billed annually unless otherwise noted. Verify at official websites before purchase.
Free Heatmap Tracking: What the No-Cost Options Actually Include
Free does not always mean stripped-down. Microsoft Clarity provides a more complete free heatmap feature set than most paid alternatives offered five years ago. Here is what the no-cost options genuinely deliver:
Microsoft Clarity (free forever): Click, scroll, move, drop-off, and predictive heatmaps. Session recordings with no session cap. AI summaries that auto-generate written behavioral insights from your data. AI chat for querying data conversationally. GDPR and CCPA compliant. Mobile SDK for app tracking. No pageview caps, no upgrade pressure. The only real constraint is that Microsoft processes your behavioral data — a trade-off some operators weigh carefully.
Contentsquare/Hotjar free plan: 200,000 sessions per month, basic heatmaps, session replays. The free tier is meaningful for low-to-medium traffic sites but lacks the zone-based heatmaps and journey analysis available in paid tiers. Historically, Hotjar’s free plan was well-regarded for usability; the feature set has evolved through the Contentsquare integration.
Matomo on-premise (free open source): The core analytics platform is free to self-host with unlimited data and unlimited hits. The heatmap and session recording plugin is a separate paid add-on — but the base platform costs nothing. This model suits technically capable site owners or developers who want full control without recurring fees. The setup requirement is higher than installing a plugin.
FullStory’s free plan covers limited monthly sessions (verify current limits at their pricing page, as these change periodically). Crazy Egg offers no permanent free tier — only a 30-day trial.
For most personal site owners and small businesses starting out, Microsoft Clarity is the logical first choice. The data is thorough, the interface is clear, and the cost barrier is zero.
Matomo vs Google Analytics: which is better for privacy?
Setting Up Heatmap Tracking on a WordPress Site
For WordPress site owners, installation is simpler than it might appear. Most heatmap tools provide either a dedicated WordPress plugin or a JavaScript snippet that loads through standard header-injection methods.
Installing Microsoft Clarity on WordPress
Microsoft Clarity has an official WordPress plugin in the WordPress.org repository. Search for “Microsoft Clarity” in Plugins > Add New, install and activate it, then connect it to your Clarity account using your project ID. The plugin handles script injection automatically — no theme file editing required. This is the easiest path for non-developers.
Alternatively, the tracking script can be added manually using a plugin like WPCode (formerly Insert Headers and Footers). Paste the Clarity script into the header snippet location, and it will load on all pages without modifying your theme files.
WPCode plugin: how to add scripts to WordPress without editing code
Installing Hotjar (Contentsquare) on WordPress
Hotjar also maintains an official WordPress plugin. Install it from the plugin directory, activate, and enter your Hotjar Site ID. For sites that prefer fewer installed plugins, the JavaScript snippet method through WPCode or a tag manager plugin works identically. The tracking code should load in the document <head> for full session capture.
Using Matomo with WordPress
Matomo offers a WordPress plugin that connects to either a self-hosted Matomo instance or the Matomo cloud. For self-hosted users, the plugin communicates with your own server rather than a third party — the data never leaves your infrastructure. The plugin is available from the WordPress.org directory under “Matomo Analytics.” Heatmap and session recording capabilities require activating the corresponding plugin within your Matomo installation (for self-hosted) or upgrading to a cloud plan that includes the heatmap module.
Best WordPress analytics plugins compared
Performance Considerations
Any third-party tracking script adds load time. Heatmap tools typically add between 10–30kb of JavaScript to your page weight. Using asynchronous script loading (which all major tools support) means the script loads without blocking page rendering. For sites where Core Web Vitals scores are a priority, loading the heatmap script via a tag manager with appropriate triggers — rather than directly in the <head> — can minimize any measurable impact.
WordPress speed optimization: reduce page load time
How to Read Heatmap Data and Actually Use It
What do you do once the heatmap is running and sessions have accumulated? Raw color gradients require interpretation to become actionable insights.
A useful rule of thumb: wait for at least 300–500 sessions on a page before drawing conclusions. With fewer sessions, visual patterns are unreliable — one user who clicked an unusual area can create a hot spot that disappears once more data arrives. High-traffic pages may reach this threshold within days; lower-traffic pages may take weeks.
When reviewing scroll maps, identify the fold point where the gradient shifts sharply from warm to cool. Content placed below that point is seen by a minority of visitors. If key information — pricing, a primary navigation option, a contact form — sits below the average scroll depth, moving it higher is usually a straightforward improvement.
Click maps reveal misaligned expectations. If an image or heading receives consistent click attention but has no link, visitors expect it to be interactive. Adding a link, or restructuring the page so the clickable element is clearly differentiated, tends to reduce confusion and improve engagement metrics.
Rage clicks point to functional problems. A section of a page with a high rage click concentration often has a bug — a broken link, a form field with a JavaScript error, an element that’s overlapping and intercepting unintended clicks. Session recordings (available in most of the same tools) let you watch the specific sessions where rage clicks occurred to diagnose the exact cause.
Dead click data guides information architecture decisions. Persistent dead clicks in a particular content area suggest users are looking for a link or interaction there. This is more common on image-heavy pages and product pages where images naturally imply clickability.
Connecting heatmap findings to specific page changes — and then measuring the change with scroll maps and click maps after the update — creates a basic feedback loop. This approach is more accessible than formal A/B testing for most small site owners and often yields clear directional results.
Conversion rate optimization: a practical guide for small websites
Privacy Compliance for Heatmap Tracking
All the tools in this comparison claim GDPR compliance, but what that means in practice varies. Understanding the specifics matters, particularly for sites with European visitors.
GDPR compliance in the context of heatmap tools typically involves several requirements. First, the tool must not collect personally identifiable information (PII) — heatmap platforms should mask form inputs, hide typed text, and anonymize IP addresses before storing data. Most major tools — including Clarity and Hotjar — do this by default. Second, data processing agreements (DPAs) must be in place between the site operator and the tool provider. Reputable tools offer DPAs for download or activation in their account settings.
Consent is a separate consideration. Under GDPR, recording behavioral data from EU visitors may require explicit consent, depending on interpretation and your jurisdiction’s specific guidance. Many sites address this through a cookie consent banner that gates heatmap script loading until the visitor accepts analytics cookies. Tools like Hotjar and Matomo have documented integration paths with common consent management platforms.
Data retention settings matter for compliance. Most tools allow configuring how long session recordings and heatmap data are stored. Setting shorter retention windows (30–90 days for recordings) reduces data exposure risk without meaningfully impairing analytical usefulness.
For organizations with the strictest data sovereignty requirements, Matomo on-premise stands apart. Data never leaves your server. There is no third-party processing agreement because there is no third party. All analytics, including heatmaps and recordings, store to your own database with your own retention policies.
GDPR compliance for WordPress: a practical checklist
Frequently Asked Questions About Heatmap Tracking for Websites
What is heatmap tracking for websites?
Heatmap tracking for websites records how visitors interact with web pages — where they click, how far they scroll, and where they move their cursor — and presents this aggregated data as a color-coded overlay on a page screenshot. Red and orange areas indicate high interaction; blue areas indicate low engagement. The result is a visual map of actual visitor behavior that complements numeric analytics data.
Is Microsoft Clarity really completely free?
Yes. As of March 2026, Microsoft Clarity is free with no stated session or traffic caps, no time-limited trial, and no paid upgrade tier. It includes click, scroll, move, and drop-off heatmaps; session recordings; AI summaries; and an AI chat feature for querying your data. The cost is zero. Microsoft funds the product as part of its Azure and advertising ecosystem rather than charging users directly. Verify the current terms at clarity.microsoft.com as policies can change.
What is the difference between a click map and a scroll map?
A click map records where visitors click or tap on a page, aggregating those interactions into a color density overlay. A scroll map records how far down a page visitors scroll, showing what percentage of visitors reached each vertical position. Click maps answer “what did people interact with?” Scroll maps answer “how much of this page did people actually see?” Both are useful for different optimization decisions and most tools include both types.
What are rage clicks and why do they matter?
A rage click occurs when a visitor rapidly clicks the same element multiple times in quick succession — a behavioral signal of frustration. It usually means the element isn’t responding as expected: a broken link, a non-functional button, a form field with a JavaScript error, or a non-clickable element that looks interactive. Tools like Microsoft Clarity and FullStory flag rage clicks automatically, making it easier to identify pages with usability problems that standard analytics would never surface.
How many sessions do I need before heatmap data is reliable?
A minimum of 300–500 sessions per page is a commonly cited threshold before visual patterns become statistically meaningful. With fewer sessions, a handful of outlier interactions can create misleading hotspots. High-traffic pages reach this threshold within days; pages that receive fewer than 100 visitors per week may require weeks of data collection. For pages with very low traffic, heatmap data should be treated as directional rather than conclusive until sufficient sessions accumulate.
Can heatmaps track mobile users separately from desktop?
Yes. All major heatmap tools allow filtering heatmap views by device type — desktop, tablet, and mobile. This is important because mobile user behavior differs substantially from desktop. Mobile users tap in different areas, scroll differently, and rarely use cursor movement. Reviewing heatmaps separately for each device type is considered standard practice, particularly for responsive sites where layout shifts significantly between screen sizes.
Does heatmap tracking slow down my website?
All heatmap tracking scripts add some page weight — typically 10–30kb of JavaScript. When loaded asynchronously (the default for all major tools), this script does not block page rendering and has minimal effect on Core Web Vitals scores in practice. The measurable impact is usually under 50ms on first page load for typical broadband connections. For performance-sensitive sites, loading the heatmap script via a tag manager with firing conditions — such as loading after the main page content has rendered — can reduce any perceptible impact further.
What is the best free heatmap tool for a small business website?
Microsoft Clarity is currently the strongest free option for small business websites. It provides all core heatmap types (click, scroll, move), unlimited session recordings, AI-generated summaries, and requires no payment or credit card to start. For small businesses that prefer not to share data with Microsoft — particularly in regulated industries — the self-hosted version of Matomo provides a free open-source alternative, with heatmap capabilities available as an add-on plugin at a modest additional cost.