

WordPress error logs are your first stop when something breaks — a blank white screen, a plugin conflict, a fatal error that no one can explain. The problem is that WordPress hides this information by default. Debug mode is off, the log file doesn’t exist yet, and there’s nothing visible to tell you what went wrong.
This guide covers five ways to access WordPress error logs, whether you’re on cPanel hosting, a managed host like Kinsta, a VPS with SSH access, or just using the WordPress admin panel. Each method is explained step by step, including what the log entries actually mean once you find them.

Quick Summary (BLUF)
If you’re in a hurry, here’s the short version:
- Fastest method (any host): Add four lines to
wp-config.phpto enable debug logging. Your log appears atwp-content/debug.log. - No code required: Install the free Error Log Monitor plugin — it reads the log and shows it in your WordPress dashboard.
- cPanel users: Find
debug.logvia File Manager atpublic_html/wp-content/debug.logafter enabling WP_DEBUG. - Developers: SSH in and run
tail -f wp-content/debug.logfor live error streaming. - Managed hosts (Kinsta, WP Engine): Your host provides a built-in log viewer — no wp-config.php changes needed.
What WordPress Error Logs Tell You (And Why They Matter)
WordPress error logs capture three categories of problems: PHP errors thrown by WordPress core, plugins, or themes; database errors when a query fails; and server-level errors from the web server or PHP itself. When your site breaks, one of these is almost always the cause.
By default, WordPress operates with WP_DEBUG set to false. This is intentional — on a live site, you don’t want error messages visible to visitors. But it also means errors silently fail, leaving you with no trace of what happened. The white screen of death, a broken checkout page, or a plugin that stopped working overnight — all of these leave evidence in error logs, but only if you’ve enabled logging.
The WordPress error log file is stored at wp-content/debug.log by default. This file only exists after you enable WP_DEBUG_LOG in your wp-config.php file and an error actually occurs. Before that, the file won’t be there — which is why many people assume there’s no log to check.
Knowing how to access and read these logs is one of the most practical skills a WordPress site owner can have. It turns a confusing broken site into a specific error message with a file name and line number — something you can actually fix.
Method 1: Enable WordPress Debug Mode via wp-config.php
The wp-config.php method is the most universal way to enable error logging in WordPress. It works on every host, doesn’t require any plugins, and gives you the most complete picture of what’s happening on your site. This is the method WordPress’s own documentation recommends.
Step 1: Access Your wp-config.php File
Your wp-config.php file lives in the root of your WordPress installation — the same folder that contains wp-admin and wp-includes. You can access it through cPanel File Manager, an FTP client, or SSH. If you’re using cPanel, log in, open File Manager, and navigate to public_html (or whichever directory WordPress is installed in).

Step 2: Add the Debug Constants
Open wp-config.php and find this line:
/* That's all, stop editing! Happy publishing. */Add the following four lines directly above that line:
define( 'WP_DEBUG', true );
define( 'WP_DEBUG_LOG', true );
define( 'WP_DEBUG_DISPLAY', false );
@ini_set( 'display_errors', 0 );
Here’s what each line does:
WP_DEBUG: Activates WordPress debug mode. Required for the other constants to work.WP_DEBUG_LOG: Tells WordPress to write all errors to a log file. The default location iswp-content/debug.log. You can also set this to an absolute file path (such as'/tmp/wp-errors.log') to store the log outside the web root.WP_DEBUG_DISPLAY: Set tofalseso errors are written to the log but not displayed on your site pages. This protects your visitors from seeing raw error messages.@ini_set( 'display_errors', 0 ): Reinforces the display suppression at the PHP level, providing a second layer of protection against errors being shown publicly.
Important: If you only add WP_DEBUG true without setting WP_DEBUG_DISPLAY to false, PHP errors will appear on your live site — visible to every visitor. Always include all four lines.
Step 3: Save and Trigger the Error
Save the file and visit your site. Perform the action that was causing problems — load the page, run the import, activate the plugin. WordPress will now log any errors it encounters.
Step 4: Find and Open debug.log
Navigate to wp-content/debug.log in your file manager or FTP client. The file will appear after at least one error has been logged. Open it in a text editor to read the error entries.
After you’ve finished debugging, disable debug mode by setting WP_DEBUG back to false — or remove the four lines entirely.
Method 2: Access WordPress Error Logs Through cPanel
If your host uses cPanel, you have two paths to error log data: the WordPress debug.log file via File Manager, and the native PHP/server error logs accessible directly through cPanel’s interface.
Find the WordPress debug.log in cPanel File Manager
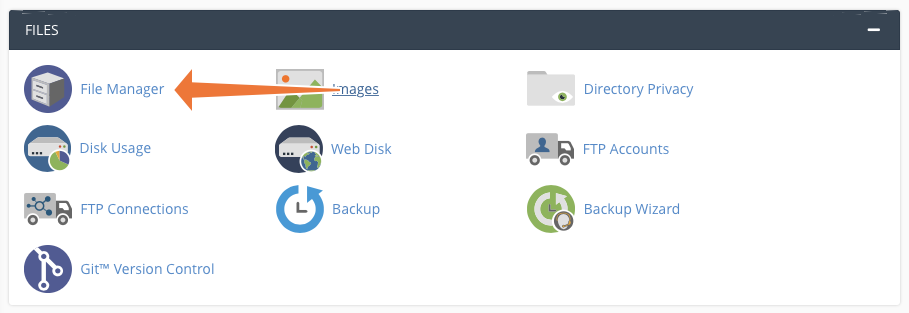
- Log in to cPanel and click File Manager under the Files section.
- Navigate to
public_html(or your WordPress root directory). - Open the
wp-contentfolder. - Look for
debug.log. If it’s not there, debug logging hasn’t been enabled yet — follow Method 1 first. - Right-click the file and select Edit or View to read its contents directly in the browser.
Access Native PHP Error Logs via cPanel
cPanel also provides access to server-level PHP error logs, which capture errors that may not appear in WordPress’s own debug log. These logs record errors at the server level, before WordPress even loads.
- In cPanel, scroll to the Metrics section.
- Click Errors to see the last 300 PHP errors from your account.
For more control over PHP error logging, use cPanel’s PHP INI Editor (under Software). Find the error_log directive and set it to a file path to enable persistent PHP error logging at the server level. This is separate from WordPress’s debug.log and captures a broader range of errors.
Method 3: Access WordPress Error Logs via SSH
SSH access turns error log checking into a real-time operation. Rather than downloading a file and opening it in a text editor, you can watch errors appear as they happen — useful when you’re trying to reproduce a specific issue and need immediate feedback.
This method requires SSH access to your server, which most VPS, dedicated server, and many managed WordPress hosts provide. Shared hosting plans may not offer SSH access — check your host’s documentation.
Step 1: Connect to Your Server
ssh username@your-server-ip-or-domainReplace username with your server user and supply your password or SSH key when prompted.
Step 2: Navigate to the WordPress Directory
cd /var/www/html/wp-content
# Or wherever your WordPress is installed, for example:
cd /home/username/public_html/wp-content
Step 3: View the Log File
To view the last 50 lines of the error log:
tail -n 50 debug.logTo watch the log in real time — new entries appear as they’re written:
tail -f debug.logPress Ctrl+C to stop the live stream.
Step 4: Search for Specific Errors
When a log file is large, use grep to filter for the errors you care about:
# Find all PHP Fatal errors
grep "PHP Fatal" debug.log

# Find errors from a specific plugin
grep "my-plugin-folder" debug.log

# Count how many fatal errors exist
grep -c "PHP Fatal" debug.log

# Show the 10 most recent entries
tail -n 10 debug.log
SSH gives you the full power of Linux text processing tools on your log files. For sites with high traffic or verbose plugins, the log file can grow to many megabytes — grep and tail handle that efficiently where a text editor would struggle.
Method 4: Use a WordPress Debugging Plugin
If editing wp-config.php feels uncomfortable or you want a friendlier interface for reading logs, debugging plugins are a practical alternative. The key thing to understand: most plugins still require WP_DEBUG to be enabled in wp-config.php — they provide a better viewer for the log, not a replacement for enabling it.
Error Log Monitor (Free)
Error Log Monitor is the most widely used free option for this purpose, with over 631,000 downloads and 20,000+ active installs on WordPress.org. It adds a dashboard widget that displays recent log entries directly in your WordPress admin, so you don’t need to download or open any files.
Key features:
- Auto-detects your PHP error log file location
- Color-coded severity indicators: red for fatal errors, orange for warnings, grey for notices
- Email notifications when new errors are logged (configurable frequency)
- One-click log clearing
- Filter by severity level or regex pattern
- Download log as a ZIP file (requires PHP 8.1+)
- Multisite / network admin compatible
Setup:
- Install and activate Error Log Monitor from the WordPress plugin repository.
- Go to your WordPress Dashboard. The error log widget will appear — if not, click Screen Options at the top and enable it.
- Click Configure in the widget to set email notifications and display preferences.
- Make sure
WP_DEBUG,WP_DEBUG_LOG, andWP_DEBUG_DISPLAY falseare set inwp-config.php— the plugin reads whatever error log PHP is writing to.

WP Debug Toolkit (Freemium)
WP Debug Toolkit is a paid/freemium option with a more polished interface, including a real-time log viewer similar to the SSH tail -f experience but inside the WordPress admin. It’s worth considering if you regularly debug sites and want a more visual tool — though for most troubleshooting needs, Error Log Monitor’s free tier is sufficient.
Method 5: Access WordPress Error Logs via FTP or SFTP
FTP (or the more secure SFTP) gives you direct file system access to your WordPress installation — including the debug.log file. This method is useful when you don’t have cPanel, SSH access is unavailable, and you need to retrieve a log file from a remote server.

Common FTP clients: FileZilla (free, Windows/Mac/Linux), Cyberduck (Mac/Windows), WinSCP (Windows).
- Open your FTP client and connect using the credentials from your host’s control panel (hostname, username, password, port — usually 21 for FTP or 22 for SFTP).
- Navigate to your WordPress root directory, then into
wp-content. - Find
debug.log. Download it to your computer. - Open it with any plain text editor (Notepad, TextEdit, VS Code, Notepad++).
SFTP is the preferred option — it encrypts your connection and credentials. If your host offers both FTP and SFTP, always choose SFTP.
How to Read and Interpret WordPress Error Log Entries
Finding the log is only half the job. Understanding what it’s telling you is where the real debugging happens. WordPress error log entries follow a consistent format once you know what to look for.
Anatomy of a Log Entry
Here’s a typical error log entry:
[15-Mar-2026 14:23:41 UTC] PHP Fatal error: Uncaught Error: Call to undefined function my_custom_function() in /var/www/html/wp-content/themes/mytheme/functions.php on line 42Breaking it down:
[15-Mar-2026 14:23:41 UTC]— The timestamp tells you exactly when the error occurred, in the server’s timezone (often UTC). If your site went down at 2:23 PM and this timestamp matches, you’ve found your culprit.PHP Fatal error— The error type. Fatal means it stopped PHP execution. Other types include Warning, Notice, and Deprecated (more on these below).Call to undefined function my_custom_function()— The error message. In this case, a function is being called that doesn’t exist — likely a plugin conflict where the function was defined by a plugin that isn’t active, or a theme function that wasn’t properly included.in /var/www/html/wp-content/themes/mytheme/functions.php on line 42— The exact file and line number where the error occurred. This is where you start looking for the fix.
How to Use the File Path and Line Number
The file path and line number are your most actionable pieces of information. If the error points to a plugin file, the fix might be as simple as deactivating or updating that plugin. If it points to a theme file like functions.php, check recent edits or the functions being called around that line.
When a log entry shows a file inside wp-content/plugins/, the plugin name is typically the next folder in the path — making it easy to identify which plugin to deactivate and test.
PHP Error Types in WordPress Error Logs
Not all errors are created equal. The error type label tells you how serious the problem is and whether it requires immediate action.
| Error Type | Severity | Stops Execution? | What It Means | Typical Action |
|---|---|---|---|---|
| PHP Fatal Error | Critical | Yes | A function or class doesn’t exist, memory limit exceeded, or similar unrecoverable error | Fix immediately — site functionality is broken |
| PHP Parse Error | Critical | Yes | Syntax error in PHP code — missing semicolon, unclosed bracket, etc. | Fix immediately — often causes white screen of death |
| PHP Warning | High | No | A problem that may cause unexpected behavior — wrong argument type, missing file include | Investigate soon — site works but may behave incorrectly |
| PHP Notice | Low | No | Using an undefined variable or uninitialized array index | Fix when possible — often harmless but indicates sloppy code |
| PHP Deprecated | Informational | No | A function or feature will be removed in a future PHP version | Note for future — contact plugin/theme developer if recurring |
| WordPress DB Error | Variable | Sometimes | A database query failed — table missing, permission issue, malformed query | Check database connection and table integrity |
A log with hundreds of PHP Notices from a single plugin isn’t necessarily urgent — many plugins generate notices that don’t affect functionality. A single PHP Fatal Error, on the other hand, means something stopped working and needs attention now.
Comparing Methods: Which Should You Use?
Each method suits a different situation. Here’s how they compare:
| Method | Skill Level | Access Required | Best For | Limitations |
|---|---|---|---|---|
| 1. wp-config.php | Beginner–Intermediate | File Manager, FTP, or SSH | Universal — works on any host | Must remember to disable after debugging |
| 2. cPanel File Manager | Beginner | cPanel account | cPanel-based shared hosting | Only works on cPanel hosts |
| 3. SSH | Advanced | SSH credentials | Developers, VPS, live monitoring | Requires technical comfort with command line |
| 4. Plugin | Beginner | WordPress admin | Non-technical users, quick setup | Still needs WP_DEBUG enabled; adds plugin overhead |
| 5. FTP/SFTP | Beginner–Intermediate | FTP client + credentials | When cPanel and SSH aren’t available | Slower than other methods; requires FTP client software |
Where to Find Error Logs on Major WordPress Hosts
Managed WordPress hosts often provide their own log viewer that bypasses the need for wp-config.php changes entirely. Here’s where to look on the most common platforms:
Kinsta
Kinsta stores logs in a dedicated /logs/ folder in your site root (not inside wp-content). Three log files are available:
access.log— all HTTP requestserror.log— PHP and WordPress errorskinsta-cache-perf.log— cache performance data
Access them via MyKinsta Dashboard > your site > Logs in the left menu, or download them directly over SFTP. You can also enable WordPress debug logging through MyKinsta > Tools > WordPress debugging without editing wp-config.php manually.
WP Engine
WP Engine provides access to error and activity logs through the User Portal. Log in to your WP Engine account, select your environment, and look for the Logs section. Check WP Engine’s current documentation for the exact navigation path, as the portal interface is periodically updated.
Cloudways
On Cloudways, navigate to your Server Management panel, then look for the Logs section under your application. Application-level logs include PHP error logs. Refer to Cloudways documentation for your specific stack (PHP-FPM paths vary by server type).
SiteGround
SiteGround users can access PHP error logs via Site Tools > Statistics > Error Log. This shows recent PHP errors at the server level, separate from the WordPress debug.log file.
Standard cPanel Hosts (Bluehost, HostGator, DreamHost, etc.)
For any cPanel-based host, use Method 2 above — cPanel File Manager for the WordPress debug.log, or cPanel > Metrics > Errors for the native PHP error log.
Security Considerations for WordPress Debug Mode
Debug mode is a diagnostic tool, not a permanent setting. Leaving it enabled on a production site creates two significant problems: it exposes server-side details to anyone who finds the log file, and it adds a small performance overhead to every page load.
Protect debug.log from Public Access
By default, wp-content/debug.log is publicly accessible. Anyone who knows the URL — https://yoursite.com/wp-content/debug.log — can read it. The log file contains full file paths, function names, plugin names, and sometimes database table prefixes. This information is useful to an attacker.
To block public access, create a file named .htaccess inside your wp-content directory (if it doesn’t already exist) and add:
<Files debug.log>
    Order allow,deny
    Deny from all
</Files>
On servers running Apache 2.4 or later:
<Files debug.log>
    Require all denied
</Files>
Move the Log File Outside the Web Root
A more robust solution is to store the log file in a location that’s not publicly accessible at all. Set a custom path in wp-config.php:
define( 'WP_DEBUG_LOG', '/tmp/wp-errors.log' );The /tmp/ directory is not web-accessible on most servers. You’ll need SSH access to read the file in this location. Make sure the path is writable by the web server user.
Disable Debug Mode After Debugging
Once you’ve found and resolved the issue, set WP_DEBUG back to false:
define( 'WP_DEBUG', false );Or remove the four debug lines from wp-config.php entirely. Leaving debug mode active on a production site provides no benefit once your problem is solved — and it keeps adding to the log file indefinitely.
Rotate and Clear Old Logs
Error log files grow over time. A very active site with verbose plugins can generate megabytes of log data per day. Clear the log periodically — the Error Log Monitor plugin has a one-click clear option — or set up log rotation on your server. A 50MB debug.log isn’t dangerous, but it’s also not useful; recent entries are what matter for active debugging.
Frequently Asked Questions
Where is the WordPress error log file located?
The default WordPress error log file is located at wp-content/debug.log within your WordPress installation directory. This file only exists if WP_DEBUG_LOG is set to true in wp-config.php and at least one error has occurred. You can change the location by setting WP_DEBUG_LOG to an absolute file path instead of true. On managed hosts like Kinsta, logs are stored in a separate /logs/ folder and accessible via the hosting dashboard.
How do I enable WordPress debug mode?
Open wp-config.php in your WordPress root directory and add these four lines above the “stop editing” comment:
define( 'WP_DEBUG', true );
define( 'WP_DEBUG_LOG', true );
define( 'WP_DEBUG_DISPLAY', false );
@ini_set( 'display_errors', 0 );
Save the file. WordPress will now log errors to wp-content/debug.log. Remember to disable this after debugging by setting WP_DEBUG back to false.
What does WP_DEBUG_LOG do?
WP_DEBUG_LOG instructs WordPress to write all debug output — errors, warnings, notices — to a log file rather than (or in addition to) displaying them on screen. When set to true, the log is saved to wp-content/debug.log. When set to a file path string, the log is saved to that specific location. It requires WP_DEBUG to be set to true first. Without WP_DEBUG_LOG, errors may be displayed on-screen but not saved anywhere.
How do I read WordPress error log entries?
Each log entry follows this structure: [timestamp] ERROR TYPE: message in /path/to/file.php on line X. The timestamp shows when the error occurred. The error type (Fatal, Warning, Notice) tells you the severity. The message describes what went wrong. The file path and line number tell you where in the code the error originated. Start with Fatal errors — they stop execution and directly cause broken pages. Notices and warnings are lower priority and often don’t affect visible functionality.
Is it safe to leave debug mode enabled on a production site?
No. There are two reasons to disable debug mode on live sites. First, if WP_DEBUG_DISPLAY is left at its default (true), errors will be shown to all visitors — exposing file paths and server details. Second, even with display disabled, the debug.log file at wp-content/debug.log is publicly accessible by default, revealing the same sensitive information to anyone who requests the URL. Always disable WP_DEBUG after debugging, and use the .htaccess protection or custom log path if you need extended monitoring.
How do I check error logs without FTP access?
Several options work without FTP. If you have cPanel access, use cPanel File Manager to navigate to wp-content/debug.log directly in the browser. If you have WordPress admin access and can install plugins, the Error Log Monitor plugin reads the log and displays it in your dashboard. If you’re on a managed host like Kinsta or WP Engine, your hosting dashboard likely has a built-in log viewer. SSH access, if available, is another option via the tail command.
What’s the difference between PHP errors, WordPress errors, and server errors?
PHP errors are thrown by the PHP interpreter — they include Fatal, Warning, Notice, and Deprecated messages originating from core, plugin, or theme PHP code. WordPress errors are application-level problems like failed database queries (logged via wp_db_error()) or authentication failures. Server errors originate from the web server (Apache or Nginx) or PHP-FPM, such as 500 errors from misconfigured server rules or PHP process crashes. WordPress’s debug.log captures PHP and WordPress errors. Server-level errors appear in the web server’s own error log (typically at /var/log/apache2/error.log or /var/log/nginx/error.log on Linux servers).
How do I prevent the debug.log file from being publicly accessible?
Create or edit a .htaccess file inside your wp-content directory and add a rule to block access to debug.log. For Apache 2.2: use Order allow,deny / Deny from all. For Apache 2.4: use Require all denied. Alternatively, set WP_DEBUG_LOG to an absolute path outside the web root — for example, '/tmp/wp-errors.log' — so the file is never web-accessible in the first place. This second approach is more secure and the preferred method for any extended debugging period.
What causes PHP fatal errors in WordPress?
The most common causes of PHP fatal errors in WordPress are: plugin or theme conflicts (a function defined by one plugin is called by another that assumes it exists); PHP version incompatibility (a plugin uses syntax or functions not supported by the installed PHP version); memory limit exhaustion (Allowed memory size of X bytes exhausted); and syntax errors introduced when manually editing PHP files. Plugin and theme updates are the most frequent trigger — an update may conflict with another plugin or require a newer PHP version than your server runs.
How do I clear or delete WordPress error logs?
The simplest method is to delete or empty the debug.log file via cPanel File Manager, FTP, or SSH. To empty it without deleting via SSH: truncate -s 0 wp-content/debug.log. If you’re using the Error Log Monitor plugin, it has a one-click “Clear log” button in the dashboard widget. After clearing, the file will be recreated automatically the next time an error occurs. If you want to stop new entries from being added, disable debug mode in wp-config.php after clearing.
Conclusion
WordPress error logs give you the information you need to diagnose problems quickly — but only if you know how to access them. The five methods covered here each suit a different situation: the wp-config.php approach works universally; cPanel File Manager is the easiest path for shared hosting users; SSH is the most powerful option for developers; plugins make log reading accessible without touching any files; and FTP covers the gaps when other access methods aren’t available.
For most WordPress site owners, the practical combination is this: add the four debug constants to wp-config.php when something breaks, install Error Log Monitor to read the log without downloading files, and add the .htaccess protection to wp-content as a baseline security measure. That setup handles the majority of debugging scenarios on any host.
Once you’ve resolved the issue, disable debug mode. Logging is a diagnostic tool — leaving it on permanently adds overhead and creates an unnecessary security exposure. The habit of enabling, debugging, and disabling keeps your site clean and your log files meaningful.